Latest news
Volatility at Lingfield
We’ve been having fun with analysing price histories at Lingfield before the off and in-play, to see how much variation in price there really is.
First, let’s take a look at the top 3 in the betting from the last race at Lingfield yesterday.

The bottom (x) axis shows the time in minutes up to the race beginning. As you can see, not really much price variation 15 to 10 minutes before the off. This is quite typical – things start to get interesting with 10 minutes to go. Here you can see strong support for True Scarlet, and corresponding lack of support for Distant Goddess. Bearing in mind all prices on Betfair will tend to 100% probability, the market confidence in True Scarlet equates almost exactly to lack of confidence in Distant Goddess, when up to that point the two were almost inseparable in the market.
As you can see, even with only one additional horse price added, Harmonious, the scale on the y axis is somewhat extended, as there is quite some variation in prices in a horse race. If we were to add the rest of the field, including the rank outside at 1000, you would not see what is really going on at the head of the market. Also, note that the small price movement in percentage terms, in Harmonious’ price, from 8.0 to 6.0 then back to 7.0, on a linear scale, is represented more than twice as strongly in terms of movement than the percentage drift in Distant Goddess’s price, which is 2.5 to 3, and therefore similar in percentage terms.
Bearing in mind that during the inplay market, one horse ends up at 1.01 and the rest at 1000, we would see none of this detail. So we’ll introduce another concept, relating to taking the log of a price briefly here, before looking at what happens to these three during the inplay market.
Taking the logarithm of a price enables us to compare percentage movements in price more easily, as well as fit more prices that are diverse on the graph, as we will see shortly.
First, here’s the above graph on a log scale.

It solves the percentage change problem.
Now, let’s look at the inplay situation for those horses at the head of the market, as log prices.

This time the x axis represents time from the start. The distance of this race is 10 furlongs, and we can see that there is not much variation until about 90 seconds into the race, when things hot up. In particular, in the last 20 seconds of the race, which is just after the final bend at Lingfield. Looking at the top 3 in the market only, clearly punters see no reason to desert the favourite in running, whose price is steady and who is clearly going well. But the second two in the market also attract a bit of interest before swinging dramatically up and down until of course drifting markedly as the favourite starts to dramatically shorten. If we look at the log price volatility of all runners we can see this even more clearly. Visually, in a race of 8 runners or more, the horses always seem to land in a heap after the final bend, with a lot of uncertainty about who will come out best.

It’s a bit of a mess trying to represent the whole field in play, but it’s easy to see that each horse is more or less keeping its own price track (in other words not shortening or drifting to overtake the price of another horse) up until about 25 seconds before the end of the race – which equates to roughly the last 2 furlongs at Lingfield. Whatever the distance, the horses always will always end up on the same stretch. You can draw your own conclusions from the above if betting in play.
If you liked this post and would like to see more price analysis and graphs like these, please let us know in the comments above or on Twitter.
Thanks!
Top 5 tips for a profitable backtolay strategy with front runners
Tip 1: Pick the right race type
Front runners occur in any type of race, so why bother with this rule? Well, remember we are trying to predict front runners based on the fact that horses tend to repeat their running style. It therefore follows that horses who have never raced have not established a pattern, and by the same token horses that have raced little have not established much of a pattern. There are better candidates for your trading money. Even when we might be convinced by a horse with only 1 or 2 runs to its name that it likes to race from the front, if it is racing in a maiden or novice race (that is, against lots of other animals who have yet to establish a pattern), it may come up against other contenders that may surprise. All this means lots of uncertainty. So if you’re looking to get more than half your trades right, you need to put everything in your favour. Click on the below example from Pacecards today on the sort of race we should avoid. Although it’s tempting, because there are a couple of runners who have had 5 runs and both have shown some front running characteristics, 1 of the runners has never raced, and 2 have raced only once, meaning half the field is seriously unexposed. Add to this the fact that 5 runs is our minimum (and the two that have raced 5 times don’t have much evidence on today’s conditions – see tip 3!), and we have yet to see how these running styles are going to pan out.
The bottom line is to avoid maiden and novice races where half the field are unraced or have only 1 or 2 runs. Ideally, you want to look for races where over half the field have had at least 5 runs. Although it’s amazing how often a horse that has only raced once or twice as a front runner follows that pattern in future, if you have next to no data about the rest of the field, this is a hopeful strategy at best.
Tip 2: Look for horses with consistent, repeating front running statistics
Analysing a horse’s performance is often a subjective business with so much data available, so it’s easy to fall into the trap of seeing what you want to see. So if you spot a front runner last time out, or over the past few runs, it’s easy to overlook all the angles available and convince yourself, based on one limited view, that it’s the strongest contender to lead the field. And it might be. But don’t miss out on all the angles available, since only one snapshot is often misleading.
Bearing in mind we need more than 50% of our trades to be profitable, we shouldn’t settle for a partial picture. that’s why in Pacecards we show you the whole picture, over a long period or a short period of time. First use the filters for 5, 10 and all runs and then sort by leader. Last but not least, how did It perform last time out? Here’s an example of what looks, at first sight, like a strong set of leader statistics in the overall view, but becomes much weaker the more we drill down:
First, looking at the averages for all runs shows us Arendelle tops the leader stats:
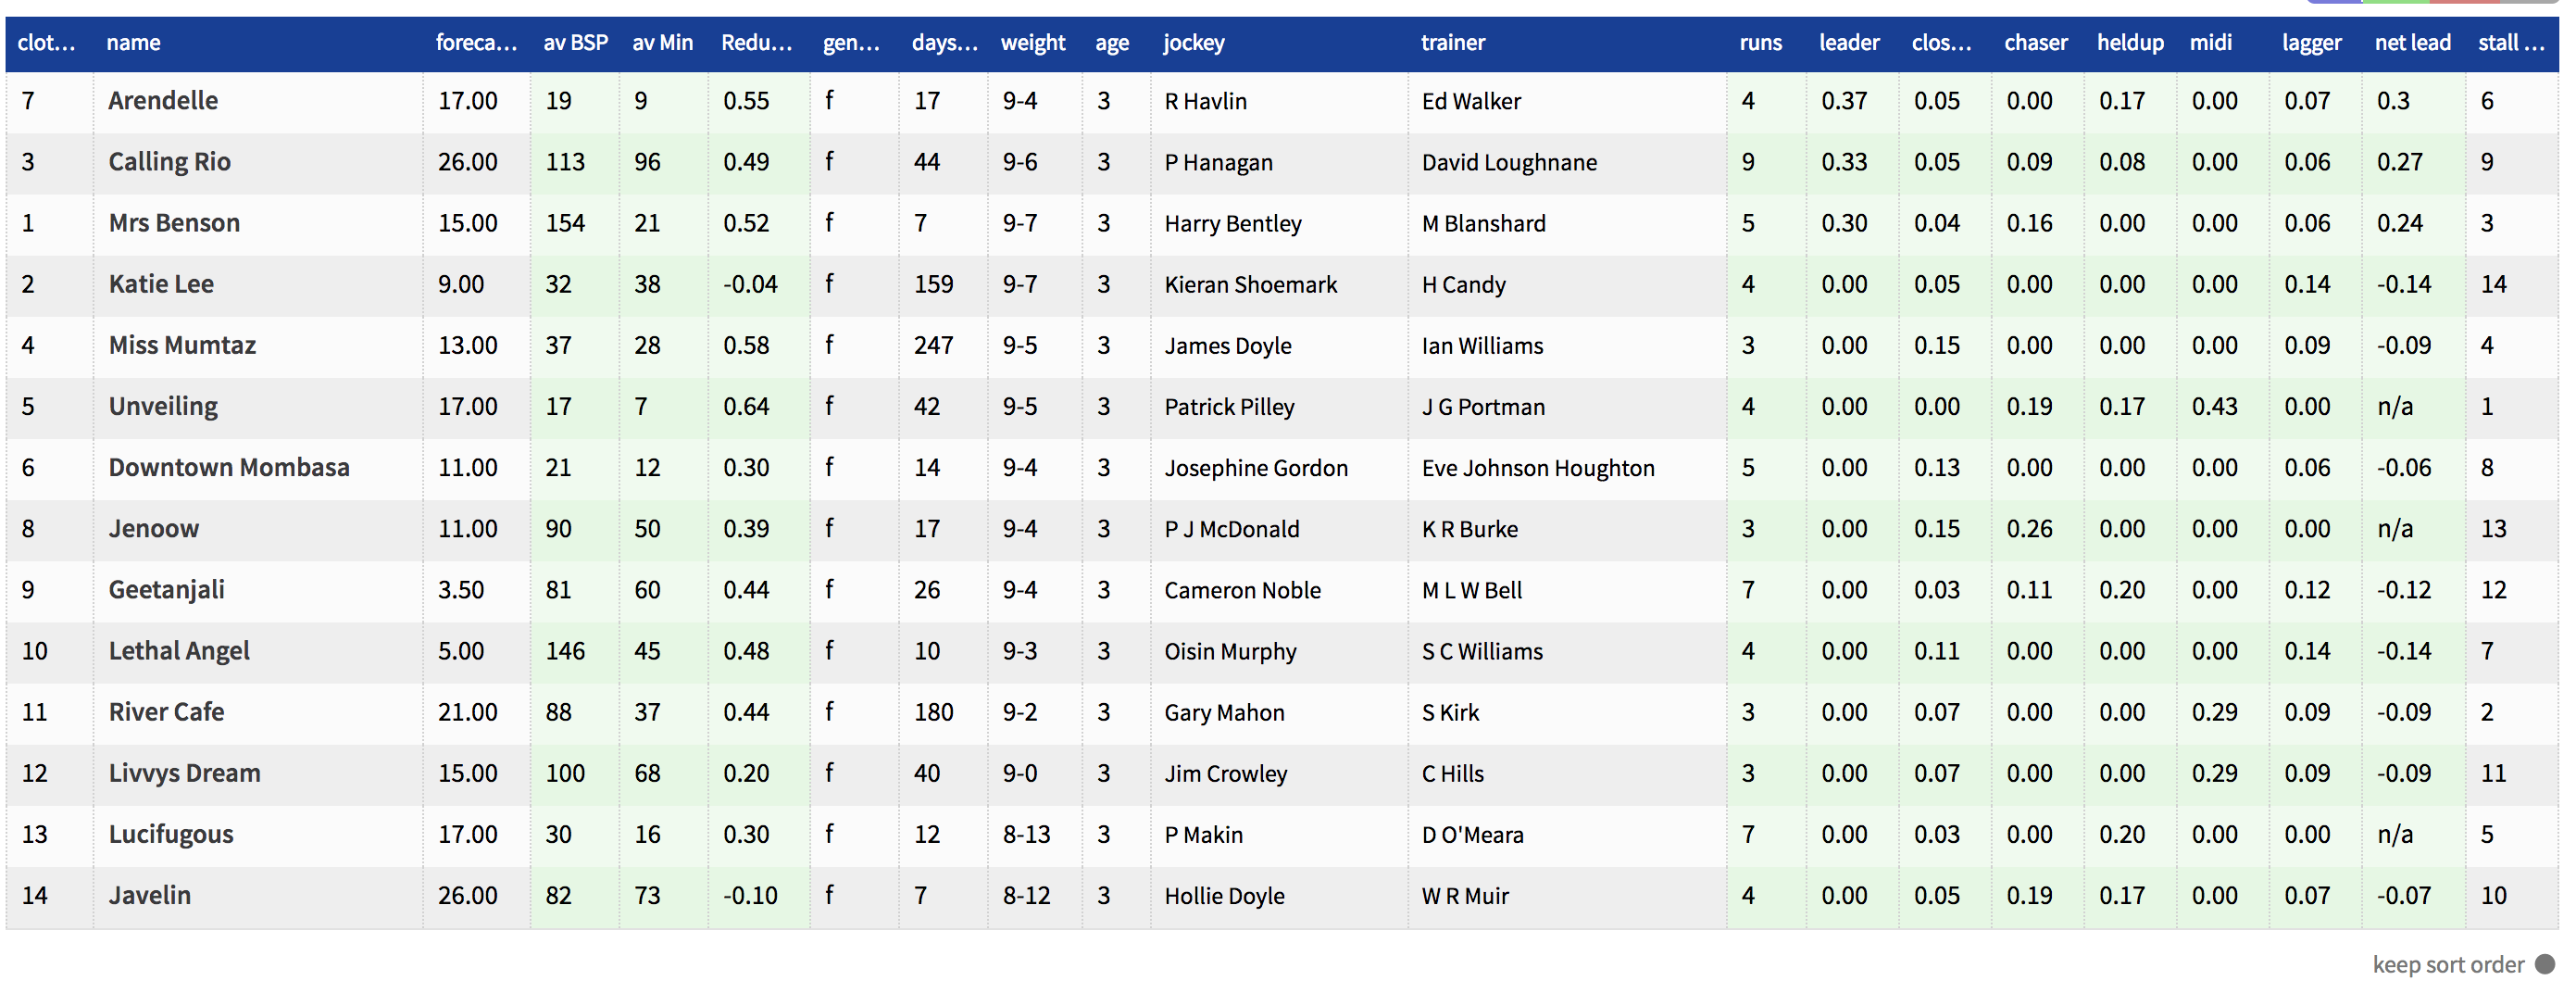
But if we reduce the field to performance over the last 5 runs, the picture flips, Arendelle moves to second, and Calling Rio emerges as a much stronger contender (for a bonus tip, always try and compare a horse over the same number of runs).

Normally, Calling Rio would be a strong call here, as it is taking more than 47% of recent front running statistics out of this field. But let’s look at what happened on its last run, and indeed what happened to the rest of the field:
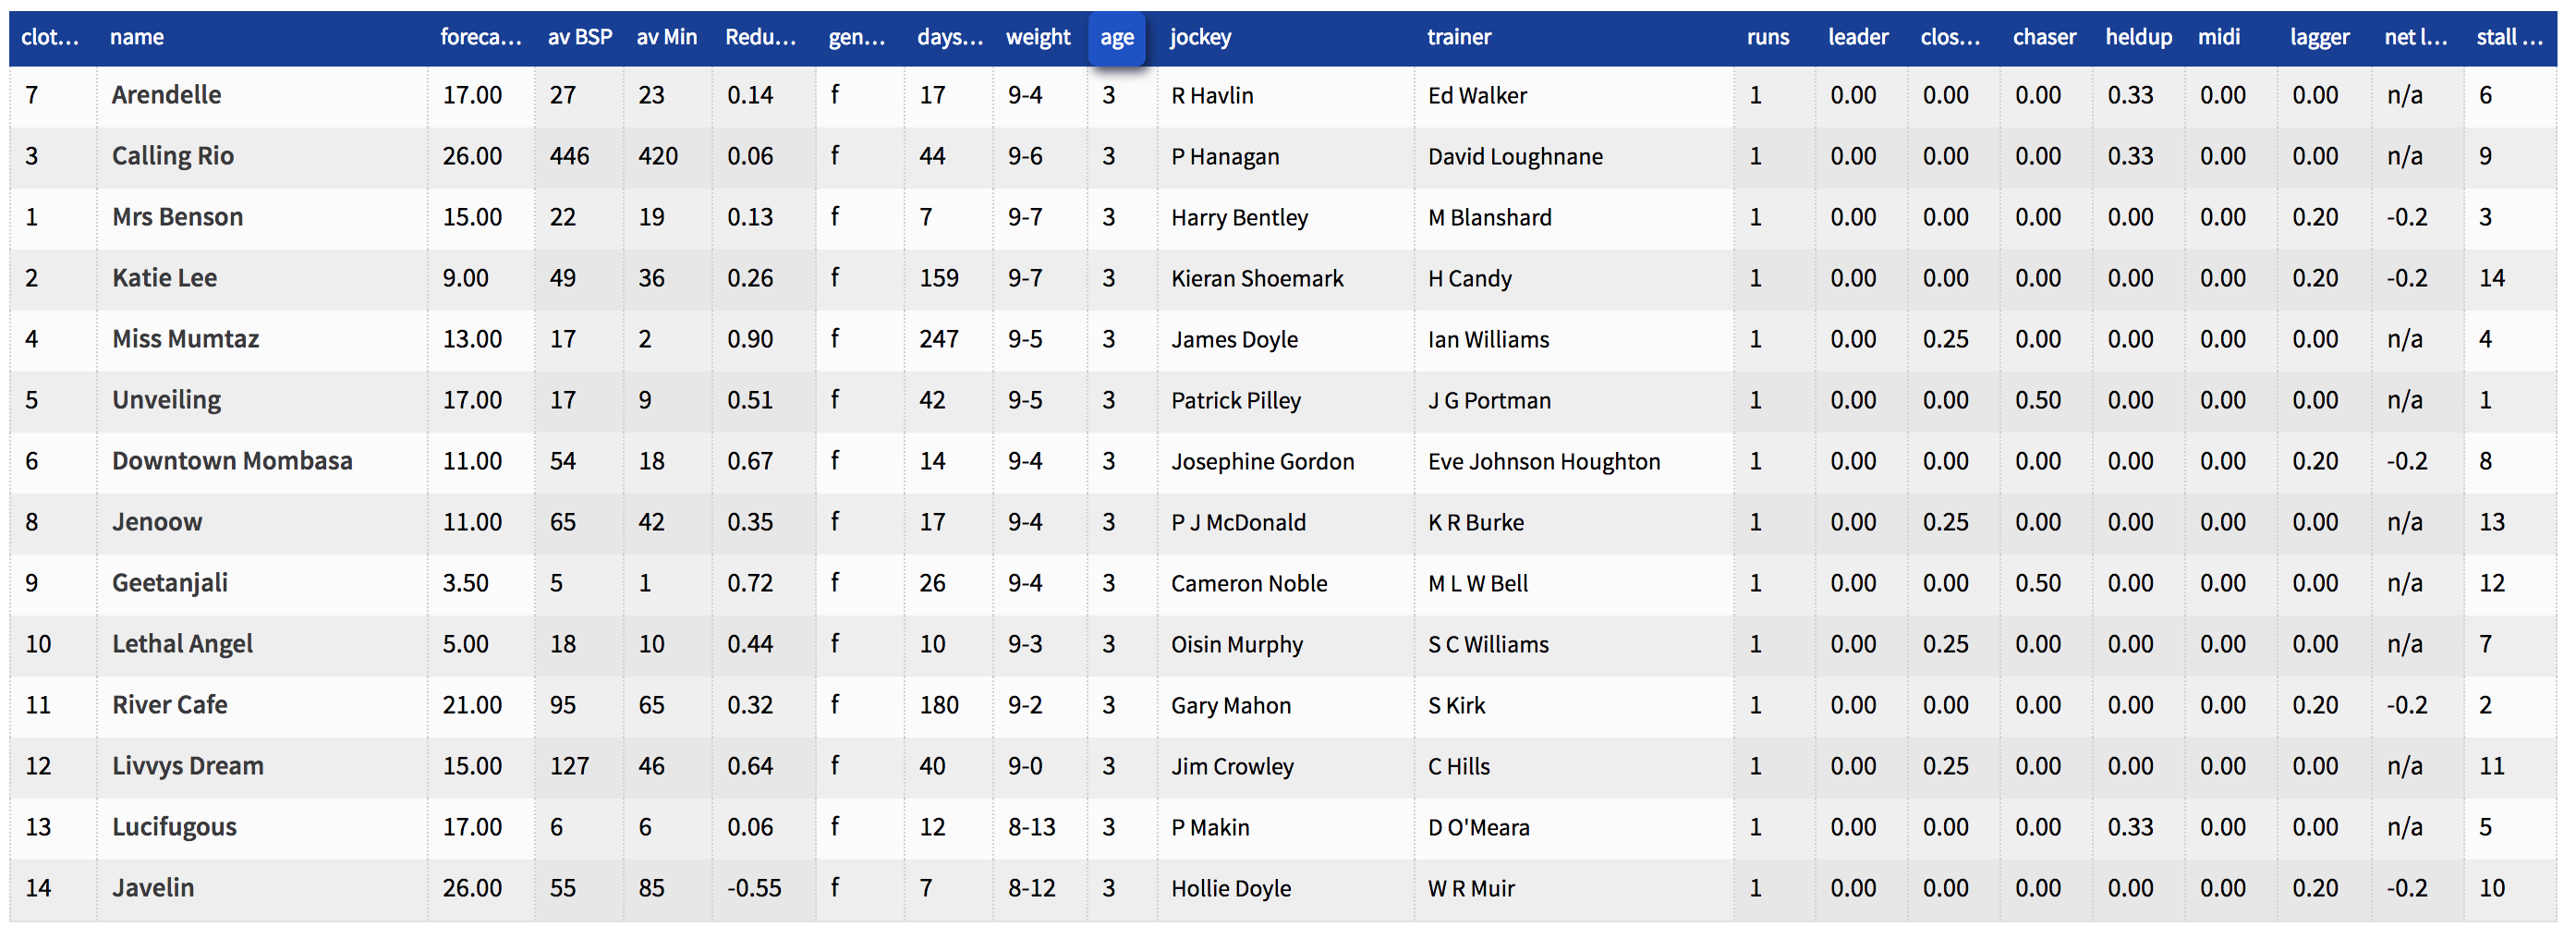
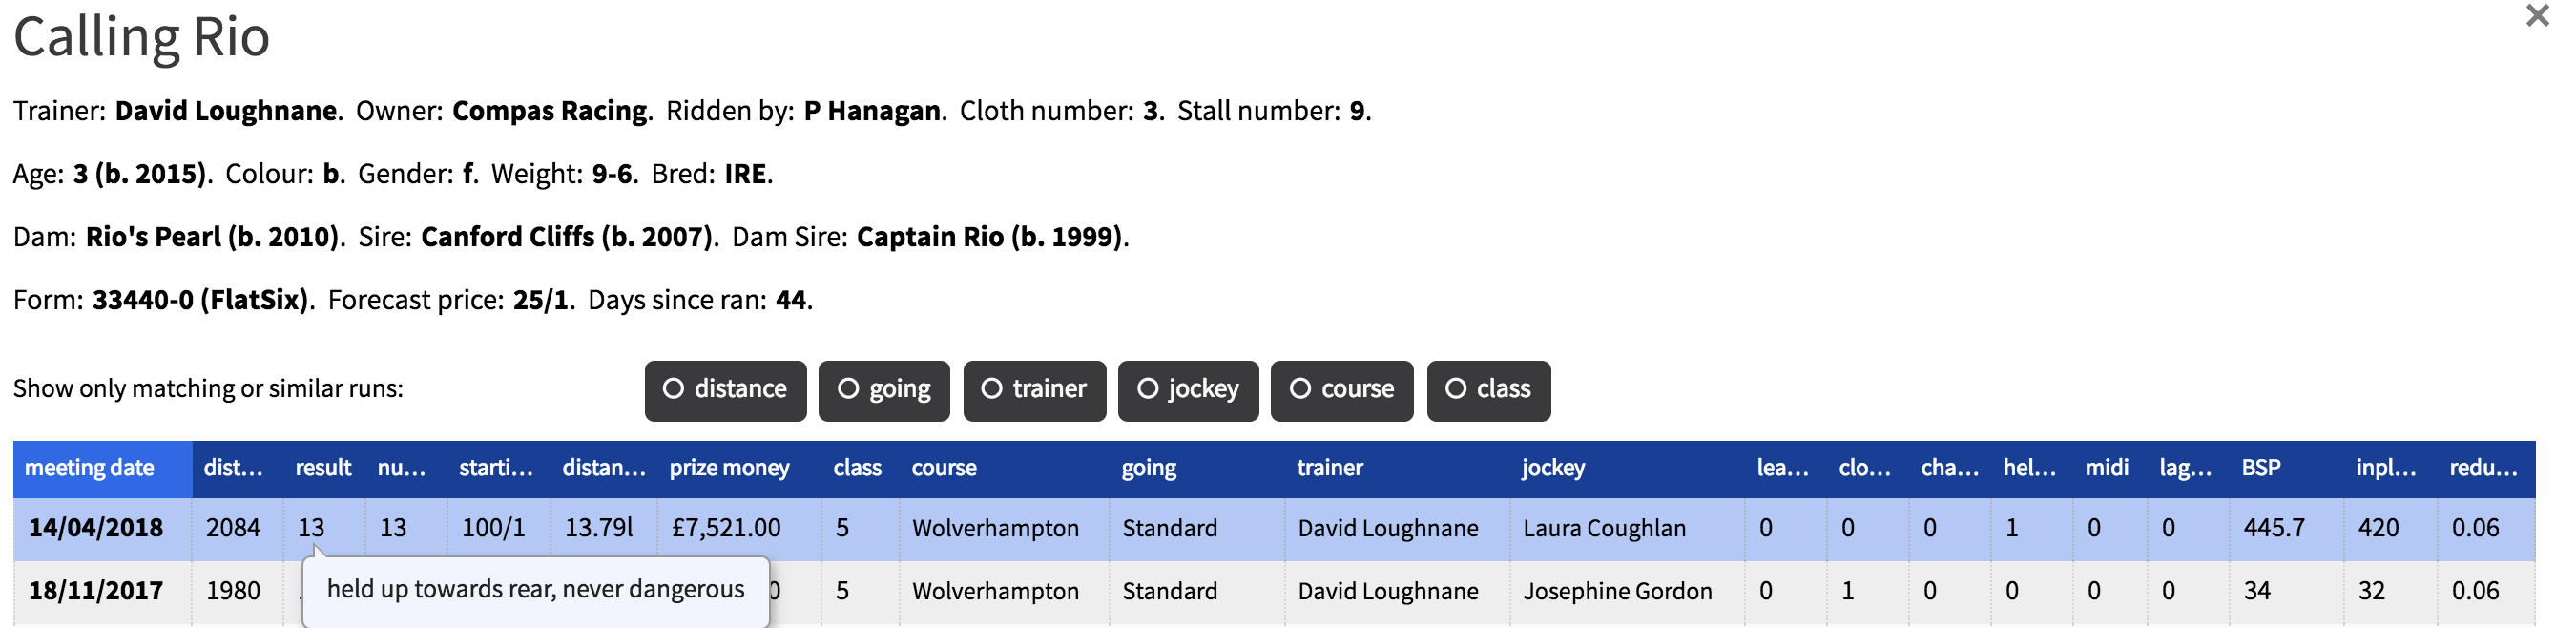
Turns out that none of the field attracted a strong front running statistic – in fact there are no leaders in the field based on their last time out performance. And on closer drilldown to the recent form of Calling Rio (by clicking on the horse’s name), we can see its last actual performance was miserable, and the horse was in fact held up – the time before was not much better. Had it raced at least close up or tried to press the pace, we might have had some reason to select it as a front runner, but this one is now worth swerving.
Maybe it will lead, since we found something in its history that was promising, but over all the horses like this we’d expect to see more fail than not.
Tip 3: Look for races where few of the other runners have shown front running potential
It’s often said that the lone front runner is a stand out bet in a race – because it can dictate the pace completely and run the race on its own terms. We could find a race with one runner that is likely to front run, but to do so would be completely misleading, because the truth is that these races are few and far between (unless they are maidens or novices, and see tip 1 about that!).
But we can often find races where there is a strong stand out front runner (that means it gets a high score on pacecards) and not many others who have shown front running potential. Heres’s one such race where only two contenders attact a score in the last 5 runs, but the top score is very high.
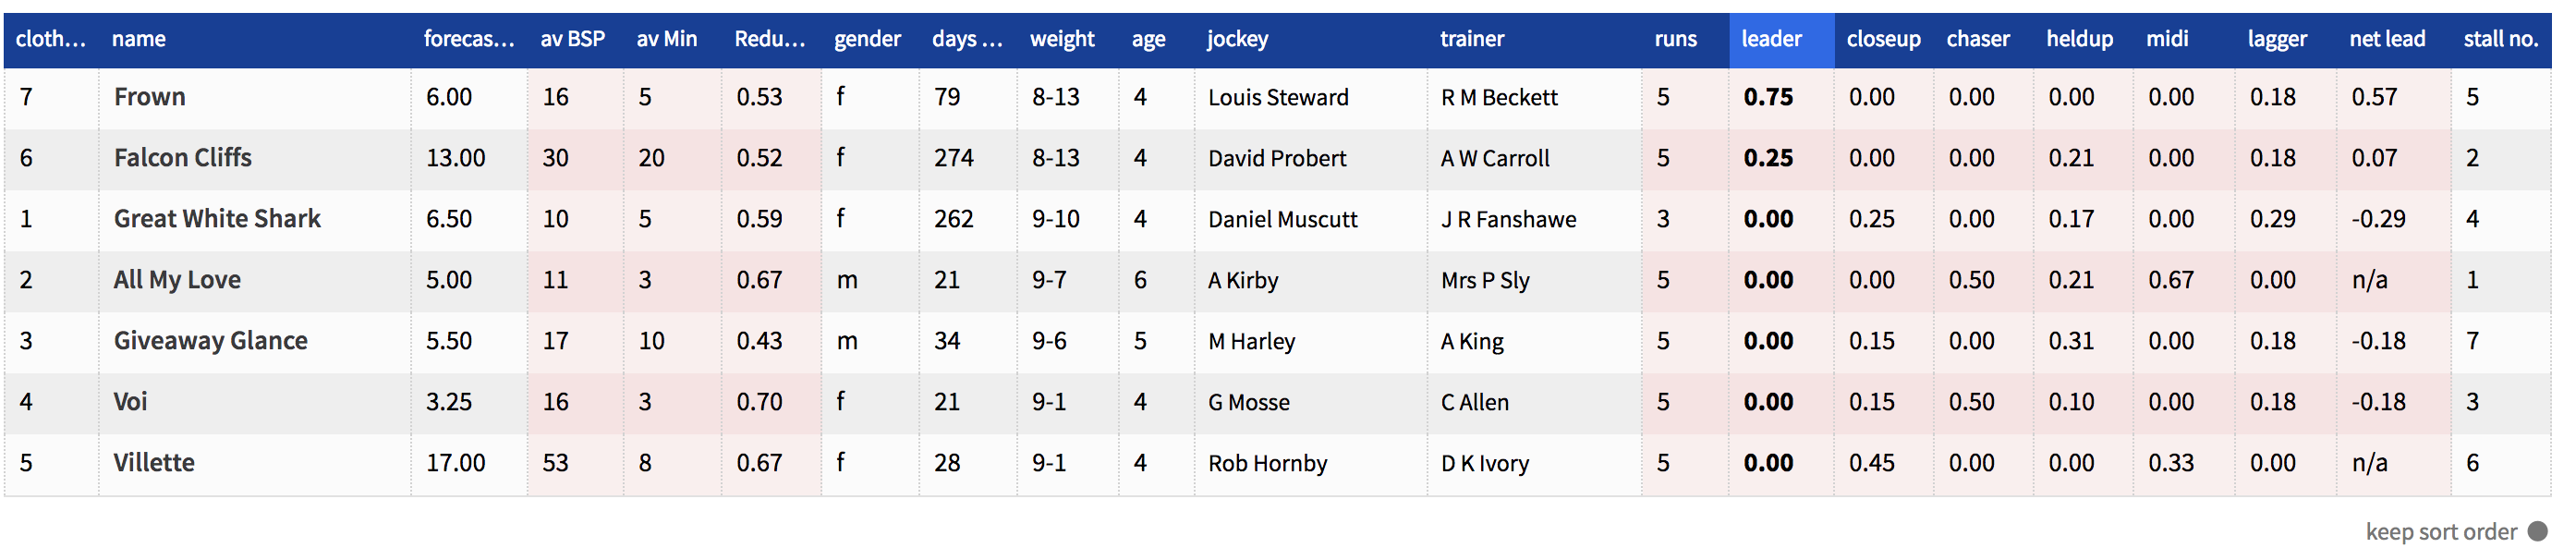
If we drill down further, we’ll find that the top scorer Frown was the only front runner last time out, and has led in all its 3 previous races. This makes the horse pretty interesting, provided we can get a good price.
Tip 4: Check the horse’s ability over today’s conditions
It’s not enough to pick a front runner, we know that the front runner has to keep the lead for a large part of the race in order for its price to contract by more than half.
When we’re looking for this kind of front runner, we really want to be on a horse that has a reasonable chance of winning the race. The only way we can quickly check that it’s going to be able to handle itself well over the race conditions is to check the obvious form criteria that it has performed well over course, distance, going and class – and last but not least that its recent form does not give cause for alarm.
Here’s a good example of a horse that, when we click on the drilldown form in pacecards, we can see has performed really well on today’s distance and going in the past. We make this easy in Pacecards by providing filters for the major form checks. Some horses don’t stack up too well once you start to apply the conditions filters – if they show they can’t handle today’s conditions, backing to lay them is more of a gamble. They may fade much earlier than you anticipate.
Tip 5: Check the price today, the horse price history and how much the back price historically reduces in play
We save the best to last. A wise man once said that betting is all about price. Sadly, if you go through all the above due diligence and find that your carefully selected pick is odds-on, you may still have found yourself one of the poorest back to lay bets ever. By the same token, for the right price, it can be worth forgiving some of the advice above.
The fact is that the shorter the price, the harder it’s going to be for a horse to halve in price in running. At the end of the day, you’ll only get a price that is offered by the market at which to lay your bet back, and the shorter the price you need to make a profit from your original back bet, the greater the chance of winning that horse will need to have. So, at one extreme, to make money from an odds-on back bet, your selection will need to still have the strongest winning chance within the final furlong. But to make money from a horse that you back at 100/1 +, your selection may only need to be in the lead for half the race. This is of course because it only has to reduce to 50/1 for you to double your money with a lay bet – bearing in mind that in this part of the market, you cannot lay to large stakes because the market liquidity will usually not take it.
So that’s your set up price – you also need to check the typically price reductions for your selections in running. And by applying the same type of filters as shown in 4. Using pacecards we can see the minimum in-play Betfair prices that horses have reached in the past, and the reduction factors that it took for them to get there. Below we’re looking at the average BSP and the average in-minimum running price for a set of horses over their past 5 runs.
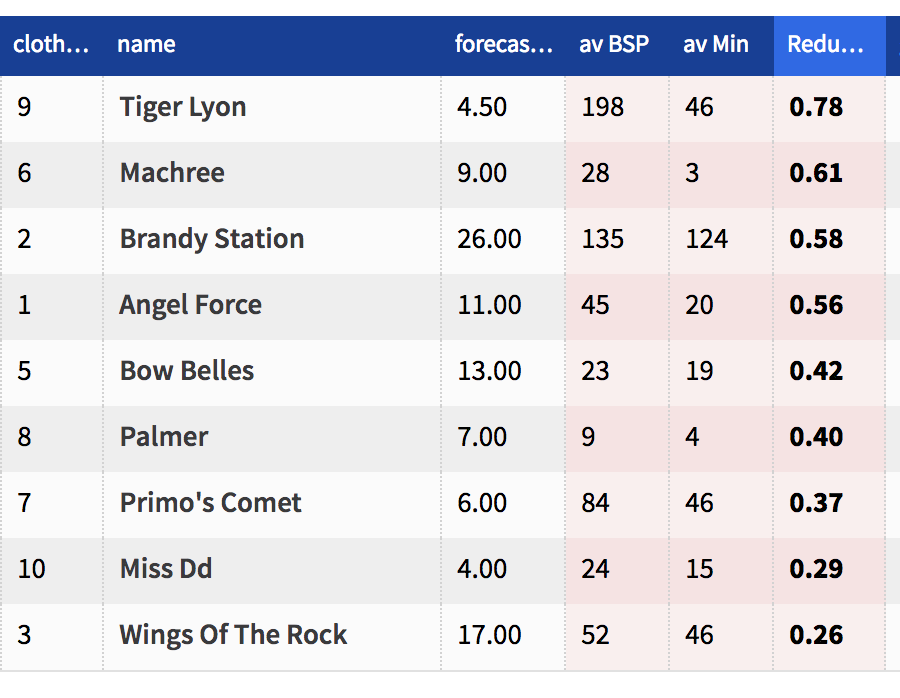
The pink section is showing us the average BSP over the last 5 runs, the average minimum price over the last 5 runs, the average reduction in price over the last 5 runs, and before that the forecast at SP based on early tissue prices (this will change to the forecast live price just before the race).
It pays to look at horses that a) show a good reduction in their odds, and b) have similar prices to their average BSP – or at least double the usual average minimum price.
We should also look at previous in-running minimum prices based on today’s conditions, which is again a smart thing to do before we start betting that a horse is going to halve (or more) to a certain level today.
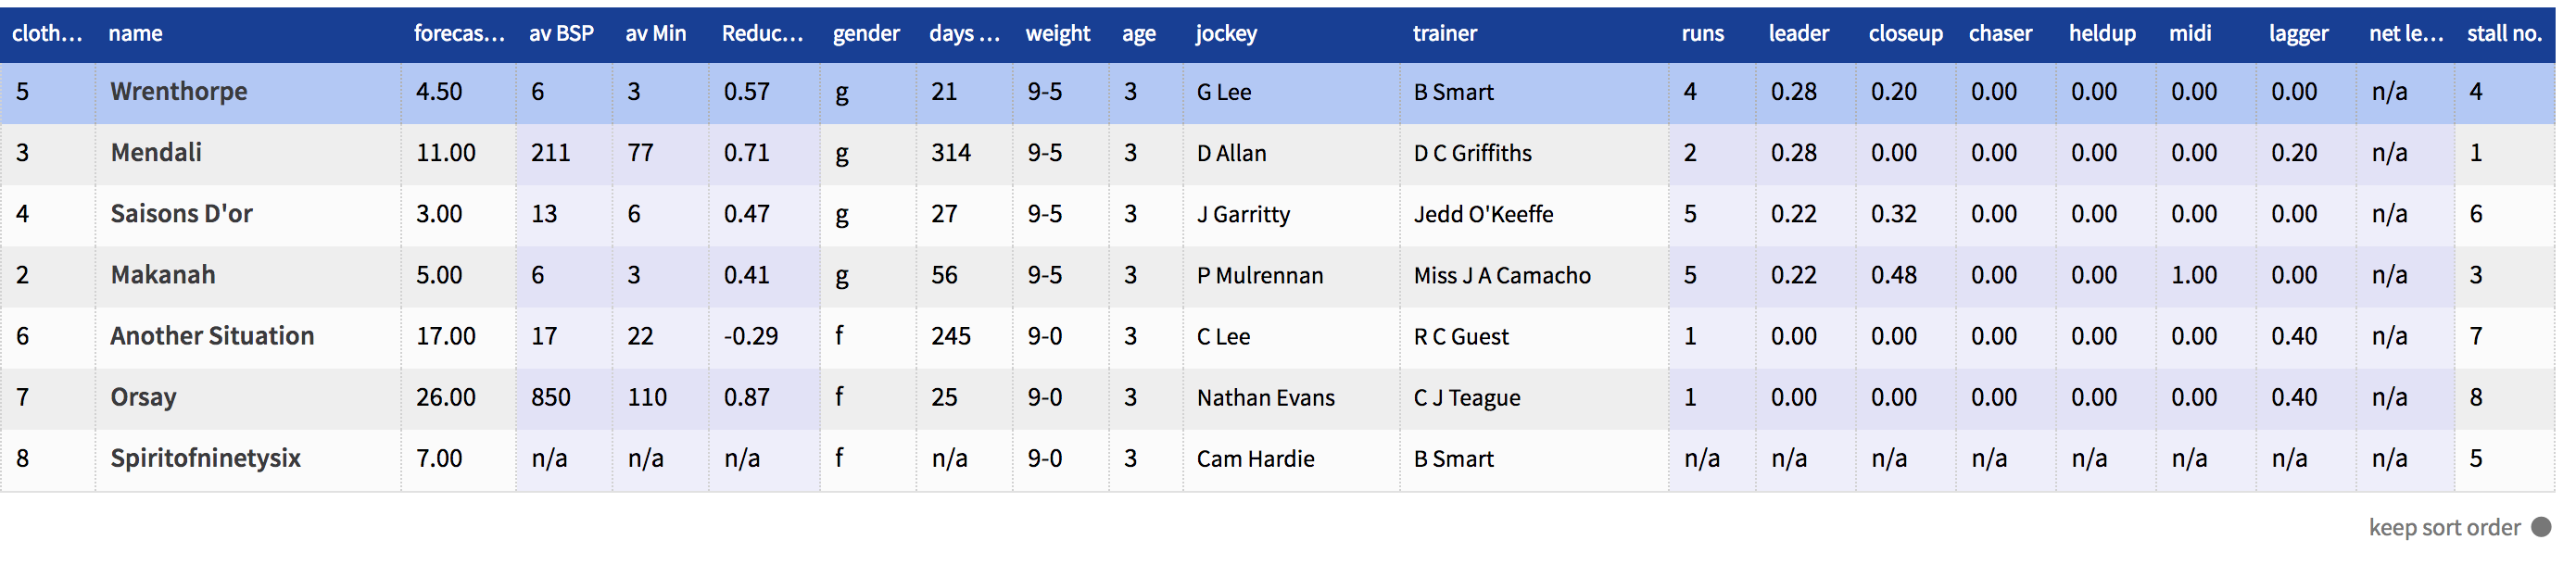
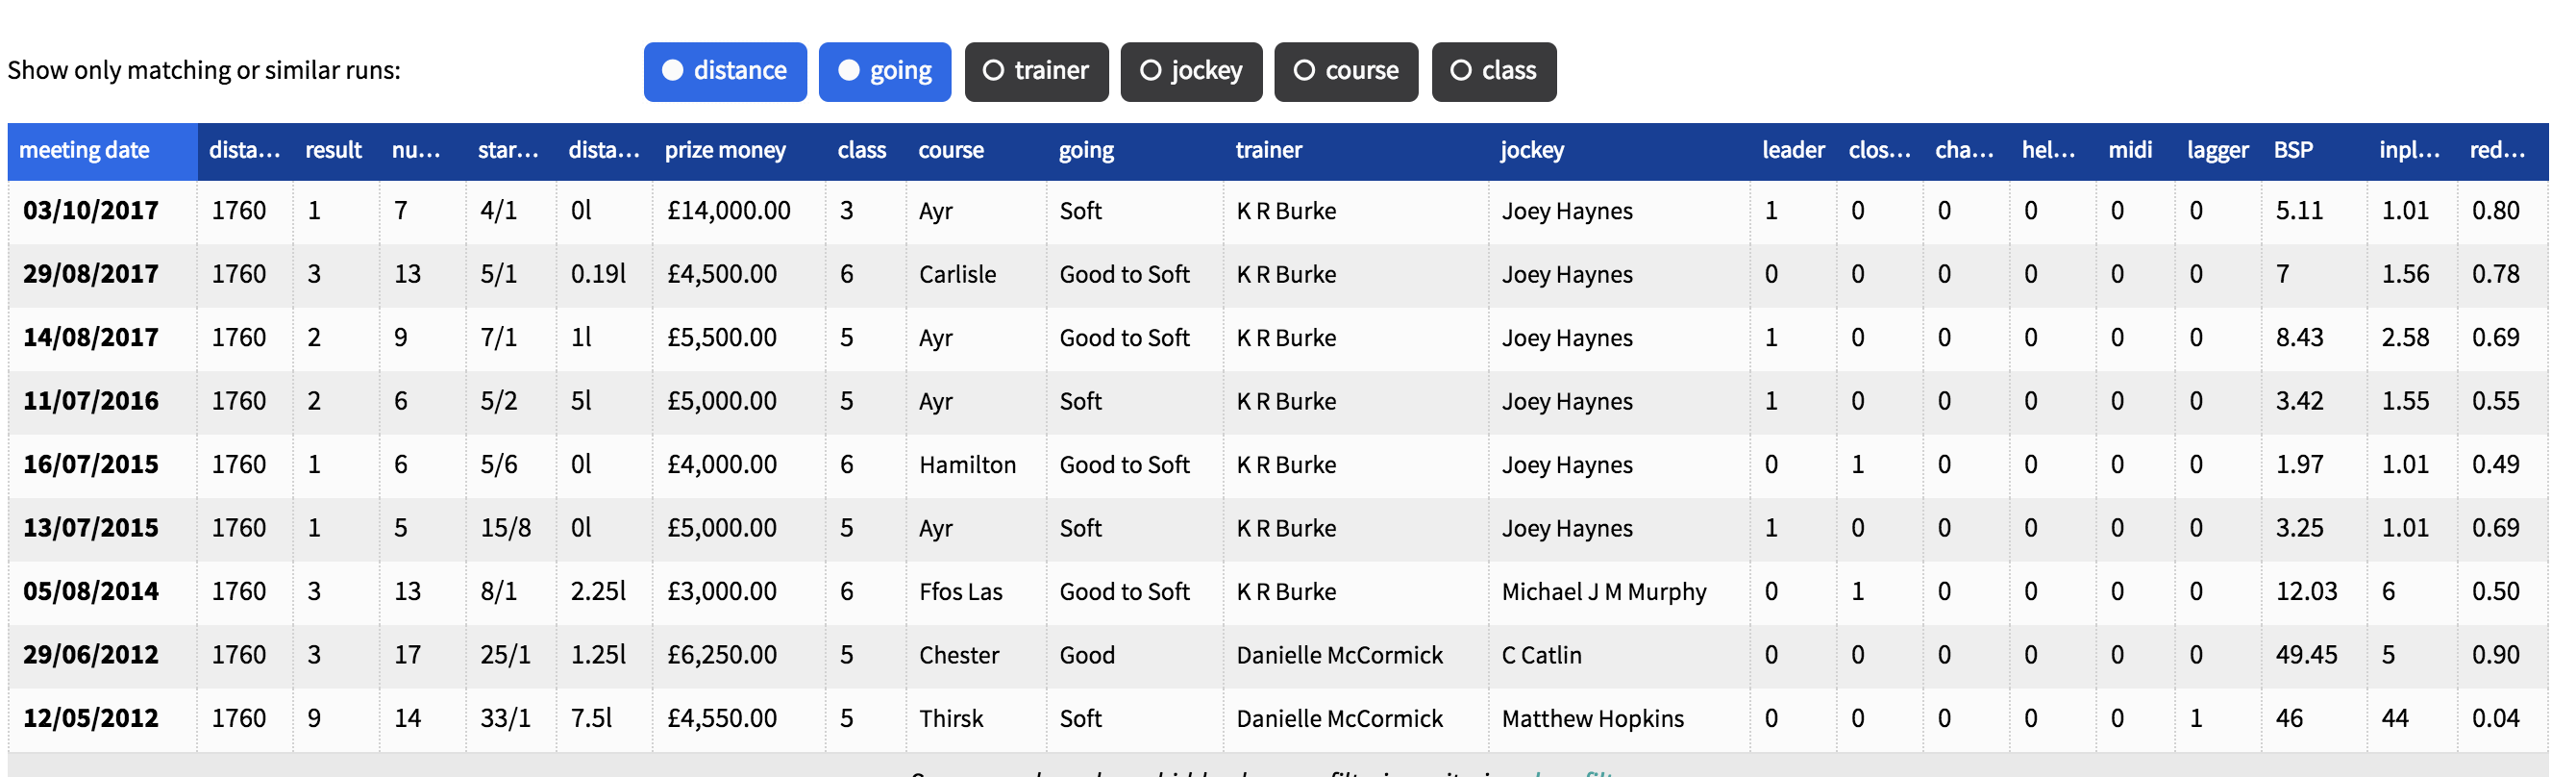
Below is the record of a forecast favourite running today, which also has excellent front running statistics, showing the minimum priced reached over all its runs.
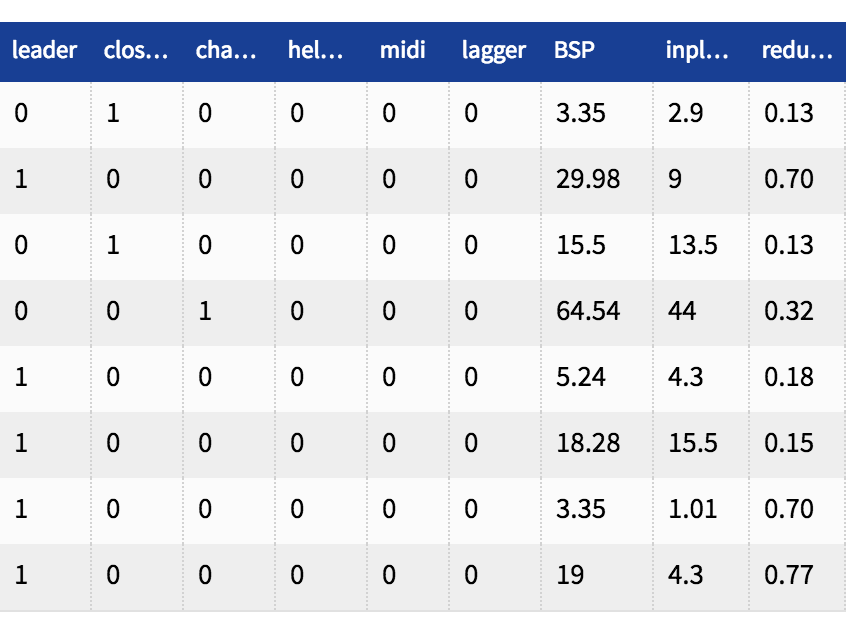
We can see that, apart from when it wins, this horse does not go that low in running – and given it’s forecast price is 4.0 (3/1) today, we would not think it is the best back to lay bet. In fact, if we like its chances, a simple win bet is probably the only sensible betting proposition.
In summary, the secret to successful back to lay betting on a front runner, is to look for strong evidence of front running over today’s conditions, strong chances compared to the rest of the field, and a price history that supports that.
Whilst this sounds obvious, the right tools to allow you to analyse this are key. The last vital ingredient is down to your judgement – assessing the chances of the horse in question, how low in price you think it can go based on evidence and other contenders in the race, and then deciding on the price you would like to set today that allows you to comfortably trade out at that price. The higher the price you get, the more you can forgive imperfections in the rest of the set up – the lower the price you get, the more you want to stick to every rule in the top 5 tips!
How to find a front runner – and why
There are many angles you can use with pacecards, but one of the easiest and most obvious angles to use is to identify the likely leader or front running horse in any given race.
Why is it a good idea to do this?
Well, for the right type of races at the right courses, horses that front run have very good winning records. So picking a likely front runner can be one of the key statistics in finding the race winner. If the front runner is unlikely to have much competition for the lead, then the chances of it winning increase. This is because such a front runner, if allowed to run the race without being pressured for the lead, can often reserve enough energy to protect their lead to the finish.